Hi John, Richard and Tancredi.
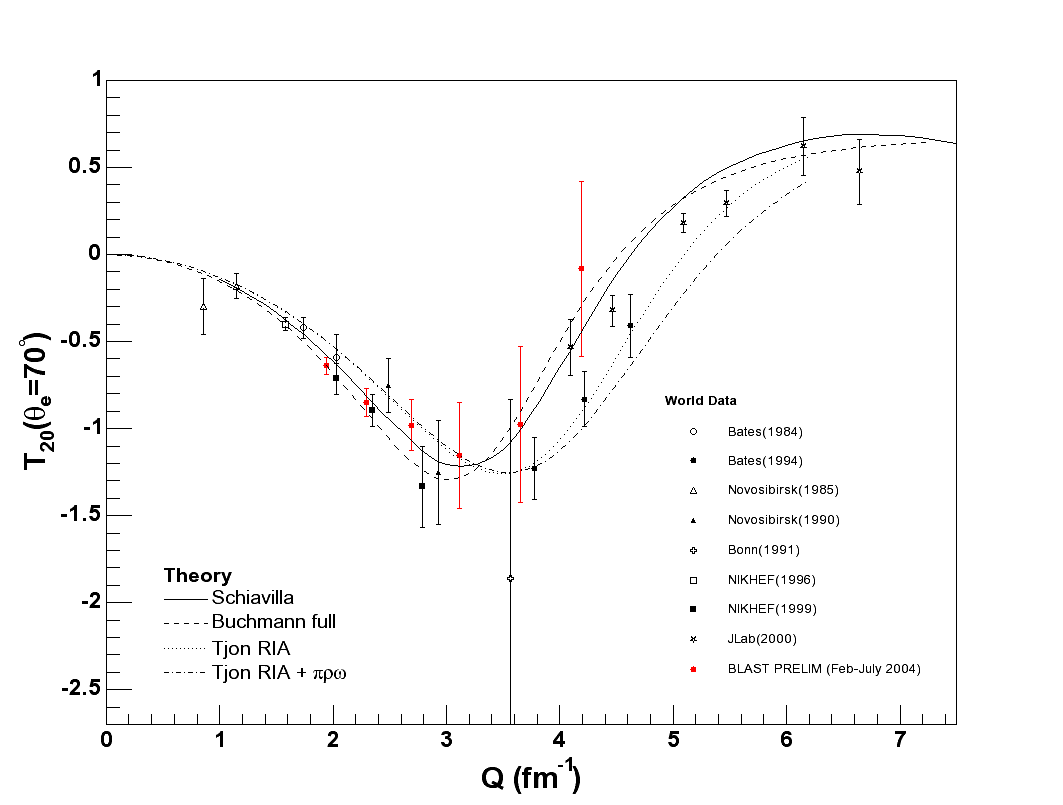
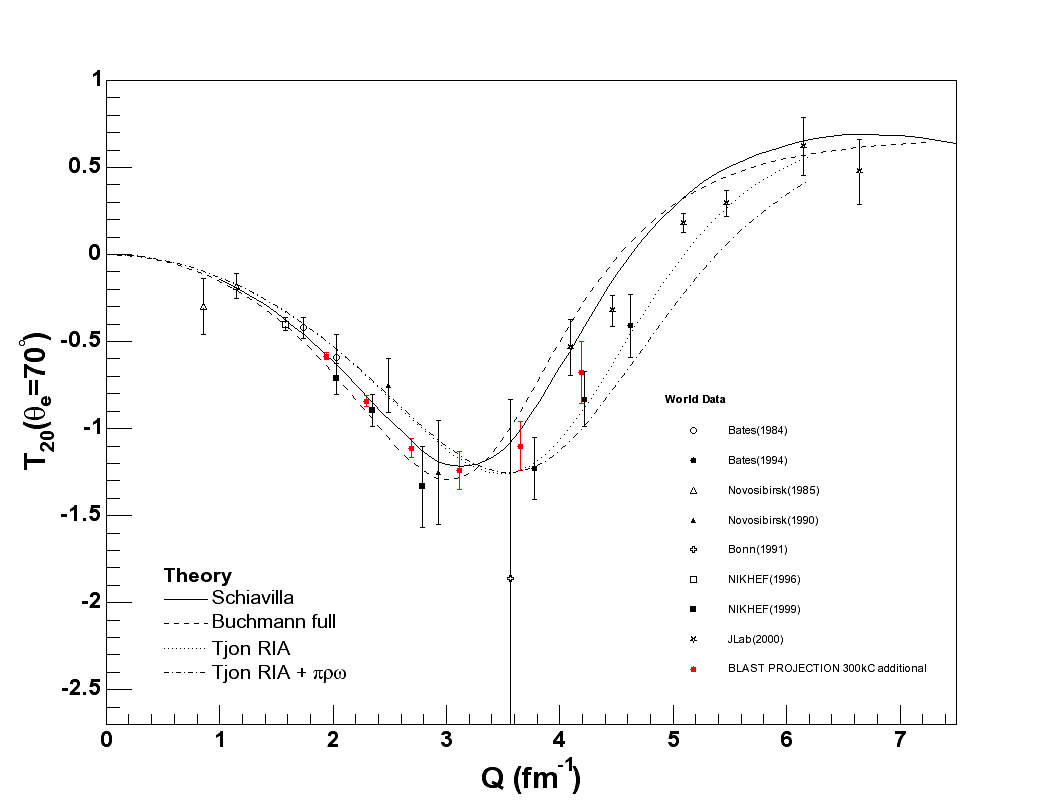
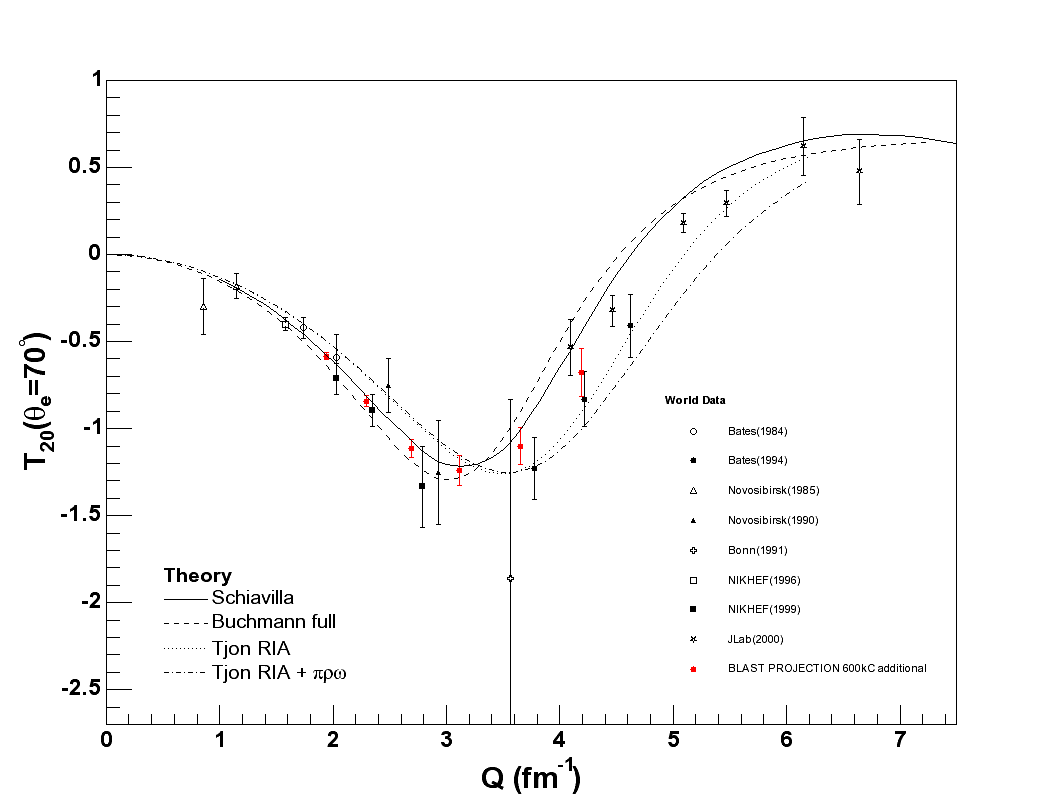
I attatched gif format for the T20 plots which are easier to put into
powerpoint. Also these plots does not show the proposal.
about my plots.
data is 180kC (179.8kC). projection is 180kC + 300kC. the other is 180kC +
600kC.
total counts is estimated from current data. MC is scaled to meet that
total counts to project errors for additional runnings. The "future"
results are then combined with current data to make the plots. So the
projection plots include everything.
Chi


This archive was generated by hypermail 2.1.2 : Mon Feb 24 2014 - 14:07:31 EST