Hi!
As I do not have a lot of improved results and so I will not give a talk
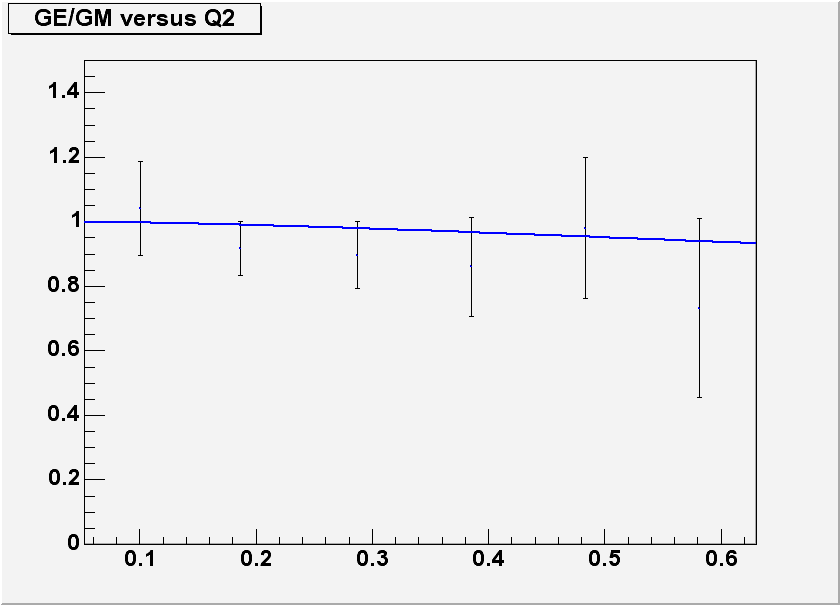
tomorrow, I thought I would just send out the latest Ge/Gm plot I have for
the H2 data we got in December 2003.
The news is that after more careful cuts (I went through all my cuts
again after Genya found a bug in my code a couple of months ago), data
points line up with the Hoeller curve.
The attached plot is for about 26 KC, representing about 500K elastic
events (I know with improved resolution we will get more events and so the
error bars will shrink).
My April H2 data points also line up with the Hoeller curve, but I just
saw that tonight after very harsh cuts... so I do not want to send it out
yet as the statistics are poor compared with December (even if we had 52
KC in April compared with 26 KC in December).
Adrian
-------------------------------
Adrian Sindile
Research Assistant
Nuclear Physics Group
University of New Hampshire
phone: (603)862-1691
FAX: (603)862-2998
email: asindile@alberti.unh.edu
http://einstein.unh.edu/~adrian/

This archive was generated by hypermail 2.1.2 : Mon Feb 24 2014 - 14:07:31 EST