.... Don't know what happened with the files... One more time with the old
message.....
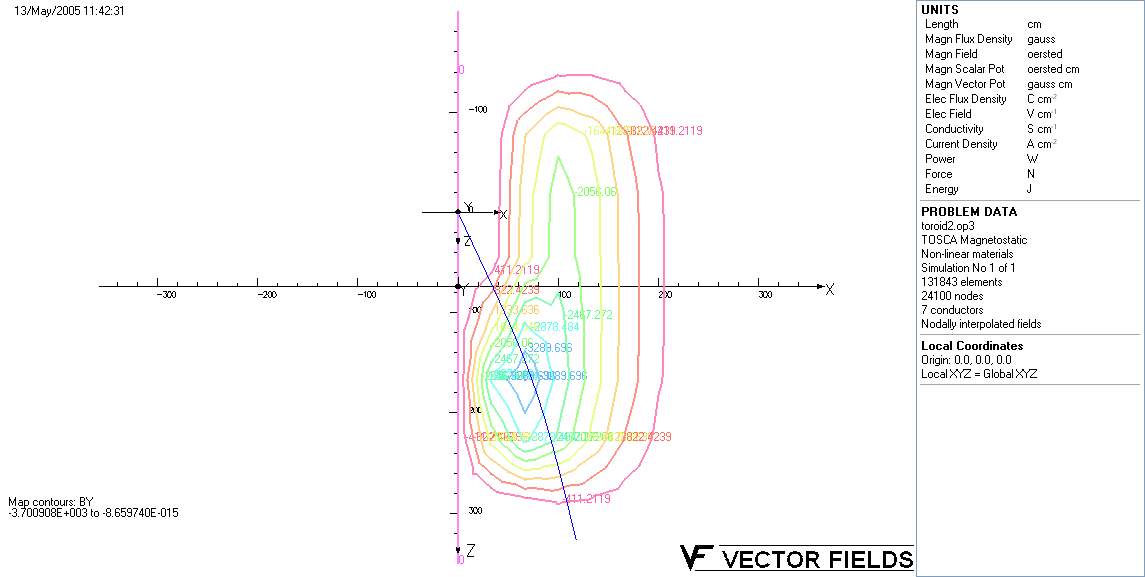
The file "Contour Field and Trajectory.png" is an overhead view of the field in
the ZX BLAST frame. It is a contour map of the field. There is a blue line
that represents a simulated electron's trajectory that came out of the origin
at a polar angle of 25 degrees and energy 850 MeV.
The track has been simulated but stepping 1 cm at a time 350 times through the
field. The file "Electron_Track_Mag.ps" is 2 plots of the deviation of the
exact same particle, i.e. same initial conditions, at each step in "No
Shielding" and "Shielding" situations. The deviations plotted are the overall
magnitude difference of the position at each step and the overall magnitude
difference of the momentum at each step. The maximum deviation proves to be
0.16 cm at a point outside the field and approximate 2.3 MeV different at the
exit from the field. This is well below our extracted offsets and momentum
resolution.
There are also three plots included which are plots of the Flux Density in the
Y direction. They are labeled as "Field_to_CC0_Done.ps",
"Field_to_CC1_Done.ps", and "Field_to_CC2_Done.ps". The fields in these three
plots have been plotted along a line stretching from the origin to the center
of
the three respective Cerenkov boxes. In each file, there are two plots. The
plot on the left is a superposition of the field simulations with (in blue) and
without shielding (in red). On the right, the ratio at accessible bins is
plotted (Shielded divided by NOT Shielded). The x-axis is the length over the
path of our plot in centimeters (the path from the origin to the CC box). Some
of the deviations in the first 100 centimeters of each plot may be results of
the Finite Element meshing or they may be real. Either way, at the deepest
center of our field, the ratio never seems to differ by more than 2%. There is
a consistent dip in each as you approach the CC boxes but the field is rapidly
approaching zero as this dip becomes more pronounced and this will not affect
our reconstruction since the electron would have already punched through the
WC's at this point.
In conclusion, TOSCA shows no major deviation that would come close to the
kinematical problems in reconstruction. Within the first 200 cm's along the
simulated path of an 850 MeV electron (slightly higher than what is actually
there, my apologies...), we remain within the width of our 200 micron
resolution in the WC's.
Michael suggested attempting to corroborate the present field map with new
TOSCA calculations. I would like to know what the format of the field map is
and where to find it. I can resume working on something like this in about 3
weeks when I'm done with the stress of moving and feeling settled back in
Arizona. That is, as long as Ricardo has purchased the program...
I'm leaving on Monday. Hope to see you all again at the next collaboration
meeting.
eugene
--------------------------------------------------------------------------
Eugene Geis
PhD Student, Physics Department, ASU
Research Affiliate, MIT-Bates Laboratory of Nuclear Science
eugene.geis@asu.edu
----- End forwarded message -----
--------------------------------------------------------------------------
Eugene Geis
PhD Student, Physics Department, ASU
Research Affiliate, MIT-Bates Laboratory of Nuclear Science
eugene.geis@asu.edu
--------------------------------------------------------------------------
http://quickreaction.blogspot.com
This archive was generated by hypermail 2.1.2 : Mon Feb 24 2014 - 14:07:32 EST