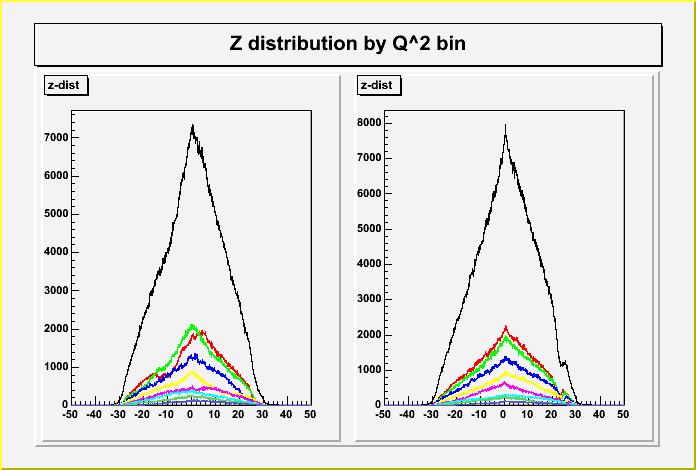
Here is a plot of the z-distribution by Q^2 bin the the H2 dataset.
I used the same cuts as my Ge/Gm analysis for obvious reasons, and
note that I am using the tighter cuts in 'phi' and 'z'. In case you
noticed, I applied the z cut after plotting the histograms to the
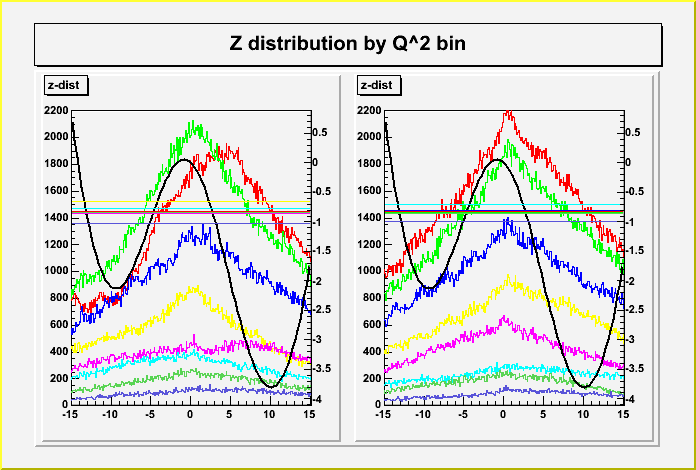
left. The second plot shows the spin angle as a function of 'z', and
averaged over the event distribution, with respect to the nominal
spin angle in Doug's spin-angle routine.
We still need to decide on the nominal nominal angle before I can
quote an 'average spin-angle from the fieldmap'.
The averages are listed below, with respect to the nominal angle.
average dbeta over all Q^2 bins (left, right):
-0.8243 -0.8299
average dbeta over each bin (bin, left, right):
0 -0.8224 -0.8232
1 -0.8541 -0.8389
2 -0.8568 -0.8045
3 -0.6605 -0.8579
4 -0.8607 -0.8624
5 -0.7804 -0.7120 Also
6 -0.8386 -0.8622
7 -1.0275 -0.9995
In my thesis, I quote a systematic effect of 0.0073 / deg of
deviation in spin angle (uniform in each sector). I'm still
exploring the implications of the above deviations, but I expect it
to be well within the current systematic error bars.
However, an item of quite concern is the gouges in the the z-
distribution, especially upstream at low Q^2 in the left sector (left
red plot). The locality in z suggests it is due to reconstruction or
a missing cell in the drift chambers. Also, the left sector, 5th Q^2
bin looks enhanced downstream (why?).
--Chris
TA-53/MPF-1/D111 P-23 MS H803
LANL, Los Alamos, NM 87545
505-665-9804(o) 665-4121(f) 662-0639(h)
This archive was generated by hypermail 2.1.2 : Mon Feb 24 2014 - 14:07:33 EST