Hello Blasters and attention H2 people,
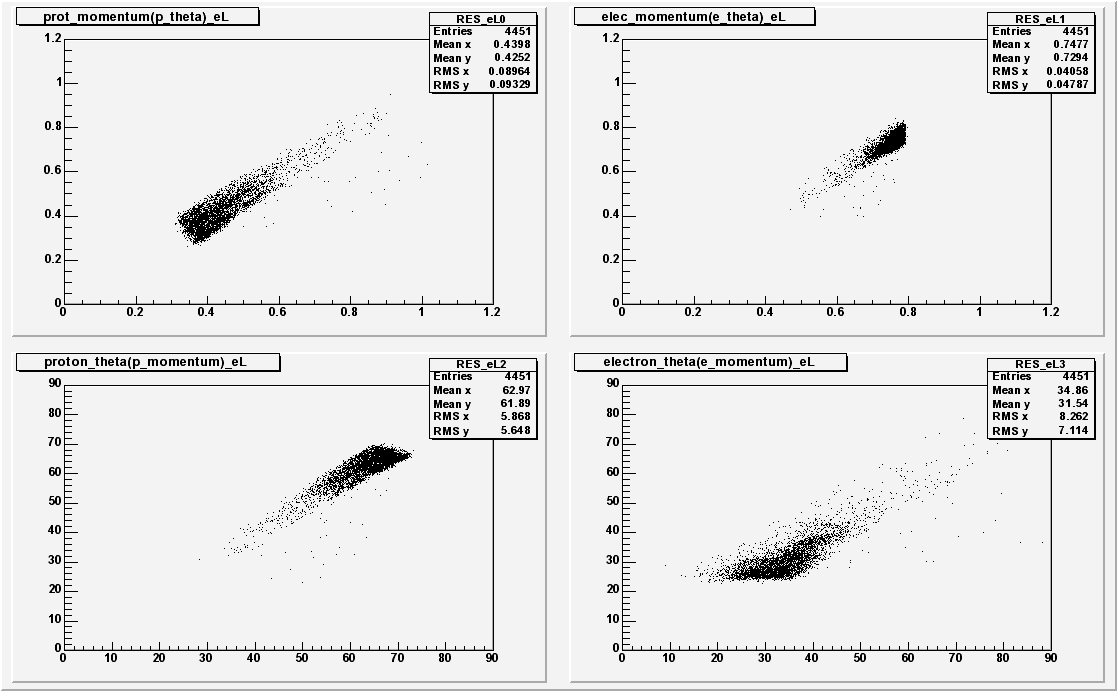
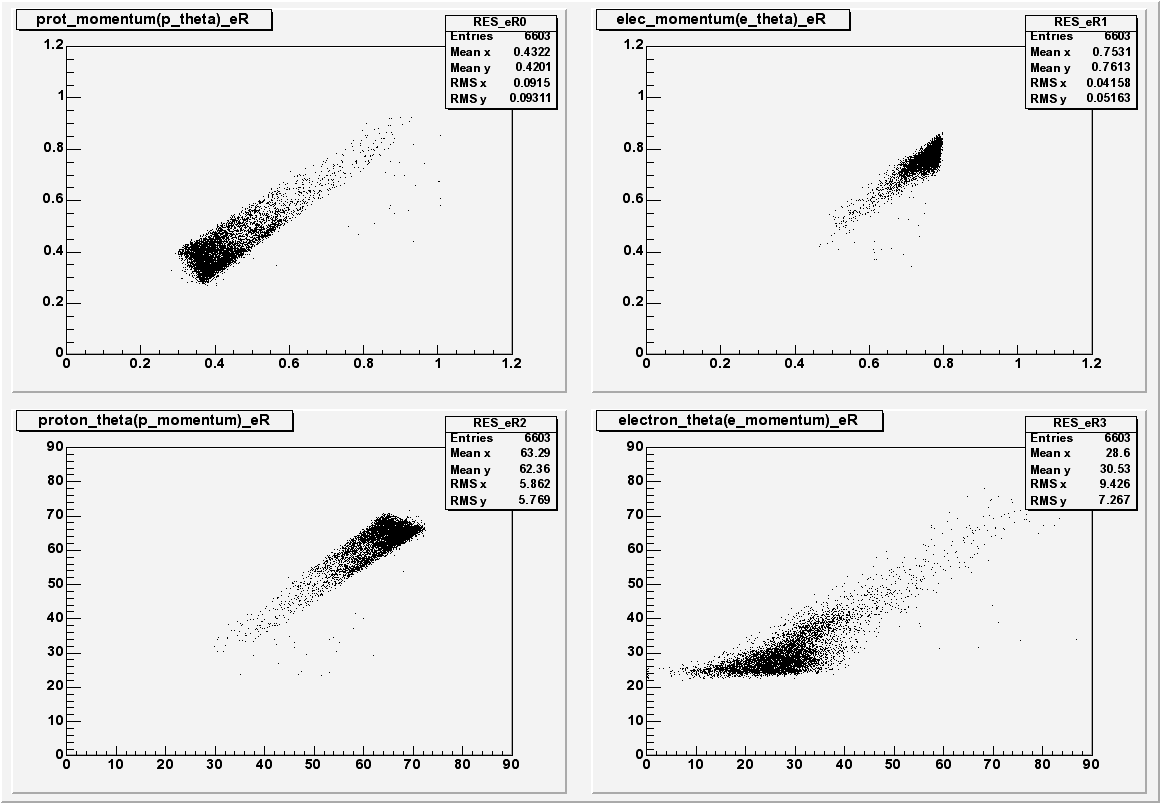
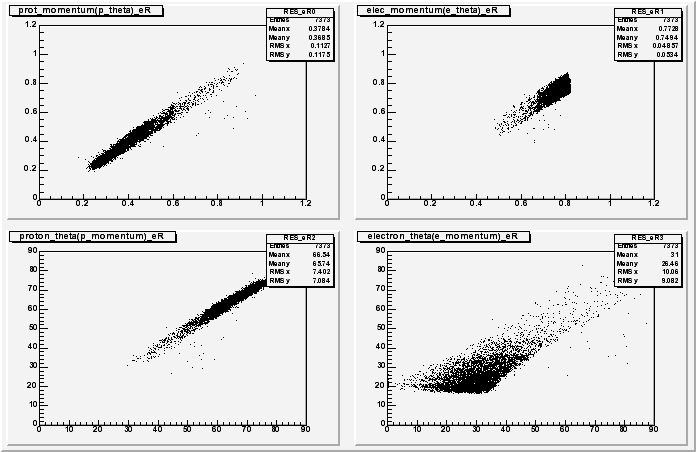
I showed these plots on Wednesday of measured momentum(theta) vs. calculated
momentum(theta) as a function of measured theta(momentum).
They were for December H2 (Outbending) runs... I have attached those plots for
both e-left and e-right elastic channel and corresponding 1D plots of
[measured momentum(theta)] minus [calculated momentum(theta) as function of
measured theta(momentum)]. Proton momentum relation fits to a gaussian with
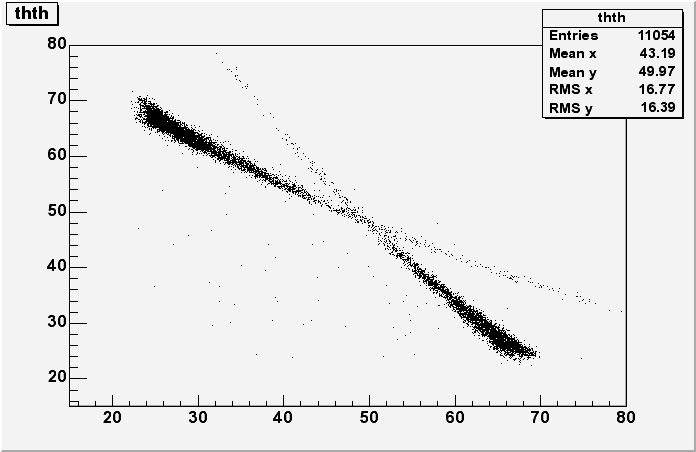
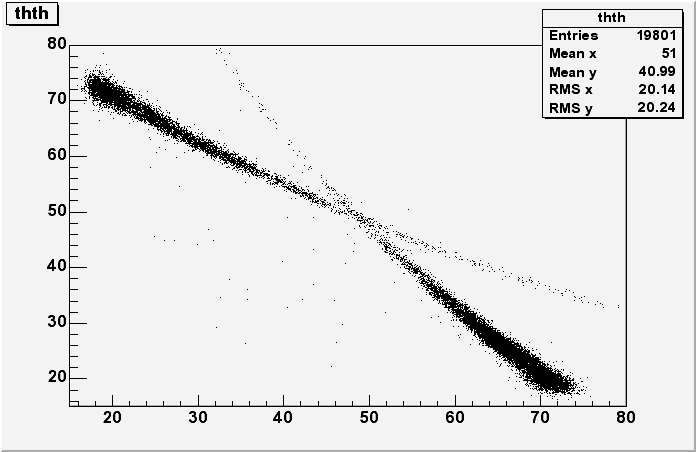
sigma = 22.5MeV. There is one more plot of the ep channel theta_e vs. theta_p
to convince you that my cuts are ok.
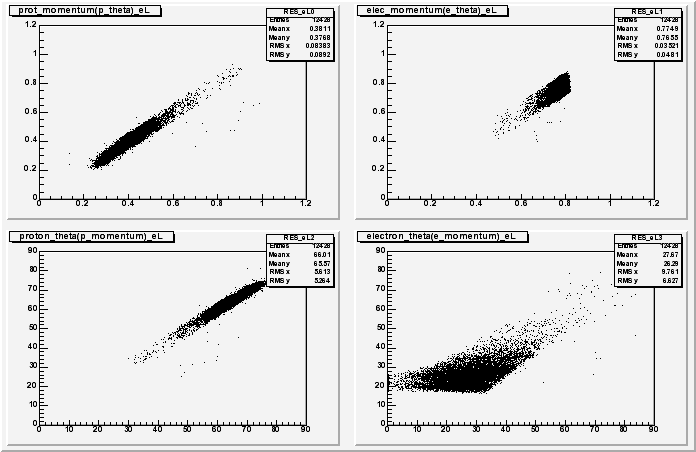
Now, also attached are the same plots for 2004 H2 (inbending) runs... Strangely
the theta vs. theta plots look very similar. Please pay close attention to the
difference of proton momentum and theta plots and if anyone can shed some light
on what might have happened... There is a -100 MeV shift in the 1D peak for
e-Right protons, and a double peak for e-Left protons. The electrons look
better... there is a sharper peak by about 5 MeV. There is no indication that
the change comes somewhere in the middle of H2 runs but must have been there
before we switched our target... ALL H2 runs from 2004 show this anomaly. I'm
pretty sure that our resolution doesn't change this significantly when we change
the field, but then again, this could solely be a function of field polarity.
In the meantime I will be searching for other symptomatic patterns suggestive of
what is going on... as well as comparing to inbending H2 runs, and then
furthermore, simple vertex, coplanarity, momentum vs. theta, momentum vs.
momentum, yadda yadda yadda...
eugene
This archive was generated by hypermail 2.1.2 : Mon Feb 24 2014 - 14:07:31 EST