Hi John et al.,
I've attached five plots illustrating the background situation of the
D(e,e'n) experiment. The data shown are the Deuterium 40cm/47degree
dataset, the Hydrogen 40cm/47degree dataset, and the Empty-Target dataset
with the 40cm cell.
I will do a similar analysis with the 60cm cell data (only few unpolarized
Hydrogen runs though), but I don't expect drastic changes.
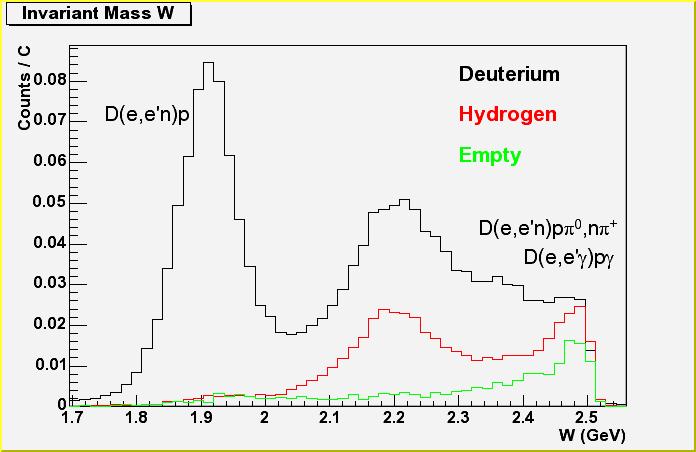
1) Invariant mass spectrum: e,e'n trigger, i.e.
electron/TOF && neutron/NoTOF && NoWch && (Ohio || LADS);
Cut on electron/neg. charge, Cerenkov, and abs(z_electron)<20cm.
No other cuts applied yet. Especially the neutral particle can be
either a photon or a neutron (to be identified by time of flight).
Shown is in black: Deuterium target, red: Hydrogen, green: Empty
target. The spectra are normalized to the collected charge in each of
the three datasets. Already without further cuts it is clear that the
background is very low and is dominated by the cell wall contribution.
In turn, the number of misidentified protons is even smaller.
A quasielastic peak is clearly visible, in which the proton target
contribution is negligibly small. The proton target contributes in the
inelastic region through the H(e,e'n)pi+ reaction.
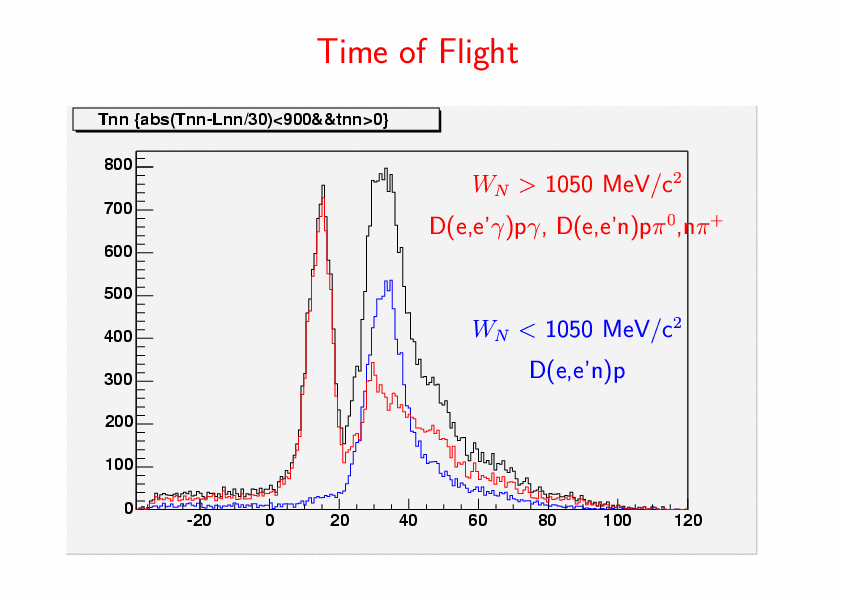
2) Time of flight spectrum: Shown here are the measured time of flight for
invariant masses below and above pion threshold and the sum of both.
Due to a bug in lrd at recrunch time in June, this spectrum contains
only events from LADS but no events from the Ohio walls.
The prominent first peak is associated with photon events, which
entirely result from the inelastic region and are attributed to the
decay of pi^0. The second peak is broader and reflects the distribution
of neutron kinetic energies or momenta, respectively.
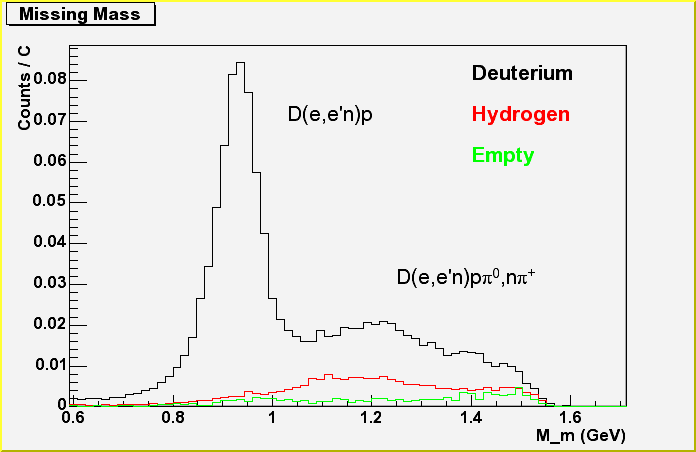
3) Missing mass spectrum: In order to generate the missing mass, neutron
information is evaluated, i.e. the photonic neutral events are
rejected. Thus the amount of events in the inelastic region (higher
missing mass is reduced by the photonic fraction of the pion production
events. A cut on the missing mass peak serves for proper D(e,e'n)p
event selection.
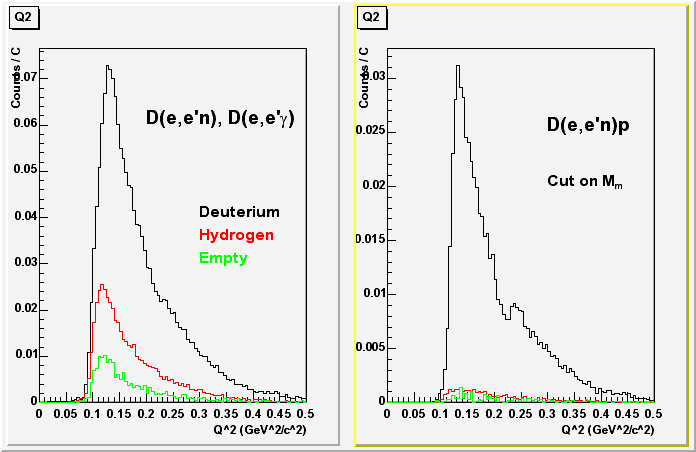
4) Q2 distributions: Left panel shows the Q2 distribution for Deuterium,
Hydrogen, and Empty target with minimal cuts (same as in Fig. 1). The
right panel show the distributions after applying a cut on the missing
mass peak shown in Fig. 3. Neither proton misidentification nor cell
wall events are of any great importance up to Q2=0.4. The next plot
will demonstrate this further:
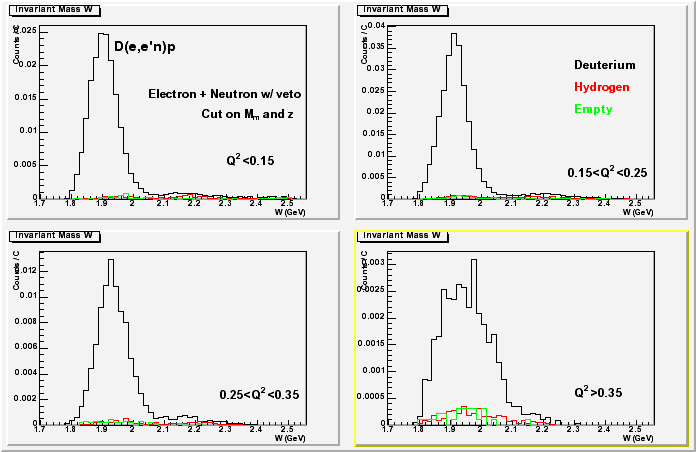
5) Invariant mass spectra for four Q2 bins and after applying the missing
mass cut: Again, the charge-normalized distributions for Deuterium,
Hydrogen, and Empty target are plotted. Even for the highest Q2 bin
(everything above 0.35 GeV^2/c^2 is collected here) the backgound does
not exceed 10% of the yield and is still dominated by cell wall events.
It is possible that the number of misidentified protons at higher Q2>0.35
might be somewhat larger for data with the 60cm cell and would therefore
dilute the measured asymmetry (as indicated in Vitaliy's plot) to a
larger extent.
I think each dataset (40cm/47degree, 60cm/47degree, 60cm/32degree)
provides enough statistics to persue a separate determination of G_En.
In combination with the background analysis to come we should become able
to understand the low asymmetry/GEn value at 0.3 GeV^2/c^2.
Regards,
Michael
--+-------------------------------------+--------------------------+ | Office: | Home: | |-------------------------------------|--------------------------| | Dr. Michael Kohl | Michael Kohl | | Laboratory for Nuclear Science | 5 Ibbetson Street | | MIT-Bates Linear Accelerator Center | Somerville, MA 02143 | | Middleton, MA 01949 | U.S.A. | | U.S.A. | | | - - - - - - - - - - - - | - - - - - - - - -| | Email: kohlm@mit.edu | K.Michael.Kohl@gmx.de | | Work: +1-617-253-9207 | Home: +1-617-629-3147 | | Fax: +1-617-253-9599 | Mobile: +1-978-580-4190 | | http://blast.lns.mit.edu | | +-------------------------------------+--------------------------+
This archive was generated by hypermail 2.1.2 : Mon Feb 24 2014 - 14:07:31 EST