Hello,
I have comleted a very prelimenary analysis of d(e,e'n)p data for a 32
degree angle data set (~134 kC). After recrunch the data finaly appears
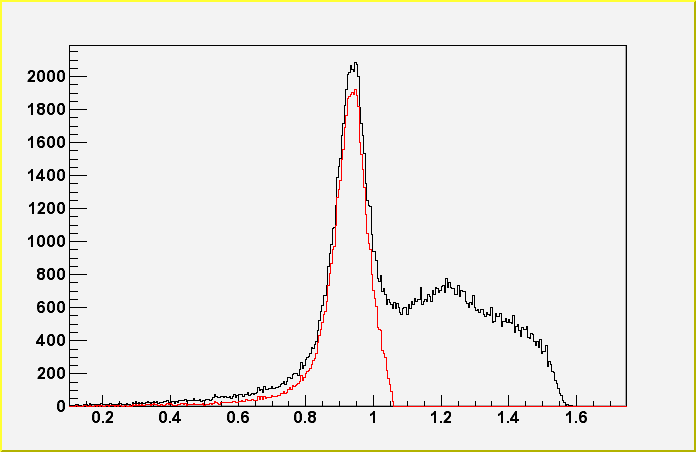
to resemble quasi-elastic scattering. I include a plot with the missing
mass spectrum w/o (black line) and with (red) cut on W. Clearly we see
a a quasi-elastic scattering peak. A better plot will be generated by
Mike with all the background from empty and hydrogen target included. I
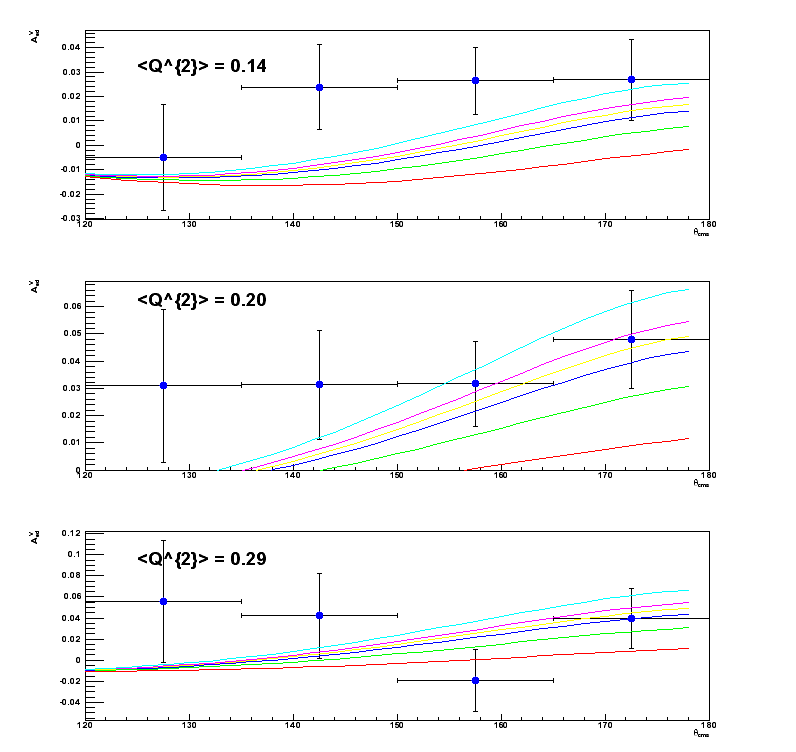
generate a vector asymmetry fro three low Q^2 bins, 0.14,0.2 and 0.29
(second plot). For each of them I fit a result of a theoretical POINT
asymmetry calculation for different values of GeN. I do have results of
full blastmc (just crunched), so if I have a little more time I can use
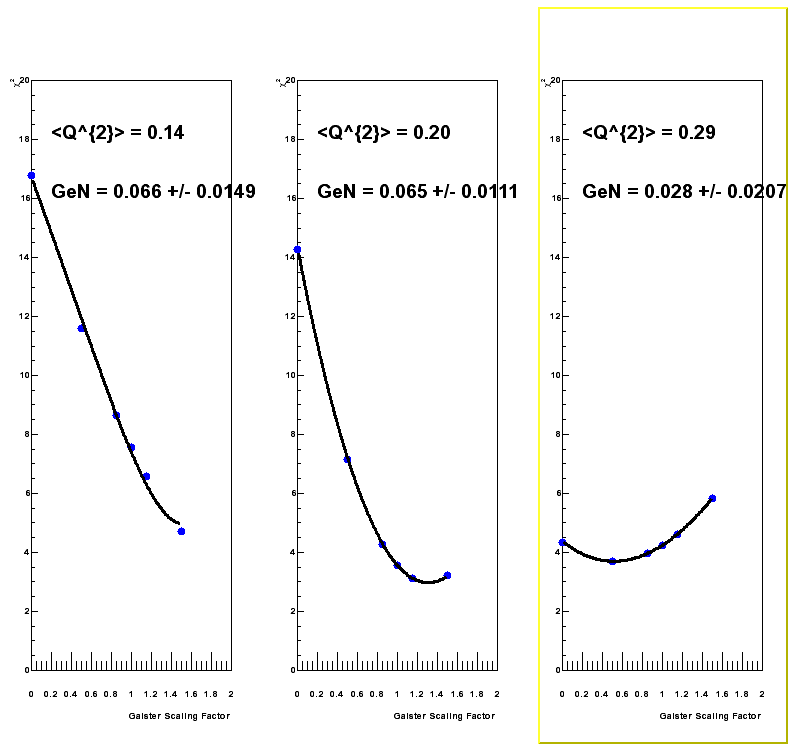
those instead of pure theory. I then chi^2 fit each individual curve to
the data and minimized chi^2 (plot 3). Looking at the chi^2 minimization
plots I'm kicking myself for not asking Dr. Arenhovel for calculations
for GeN= (1.75,2.0)*Galster. This oversight will be corrected shortly.
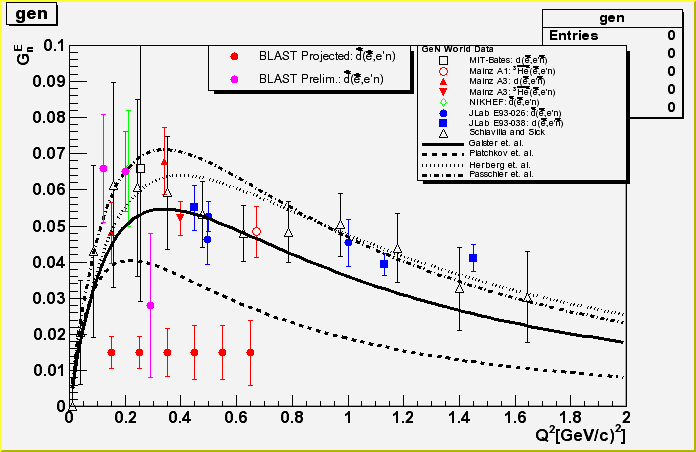
From this minimization I have most likely values of GeN which are then
plotted on the word plot as magenta (I think) points. Few comments on
each of those points:
1)First point seems has 25k of events and seems very stable under all
cuts. However, it suffers from the fact the in a chi^2 fit it has no
data at which chi^2 would start rising again and the error bar reflects
that. This will be corrected shortly (unless Dr. Arenhovel is on long
vacation).
2)Second point is more or less a NIKHEF point (green) and it agrees with
it very well. Better error bars are due to a higher figer of merit.
This bin has 20k of events.
3) Third point is most problematic. I suffers from lower statistics and
also I noticed a strange cut dependence in it's result. This indicates
presence of unpolarized background, which given some more time I can try
to correct for. This bin only has 8.7k of events.
4)It is hard to do any kind of projections based on this data since it
is a compilation of many running conditions during which neutron
effiency, target and beam polarization, etc. changed. I'm currently
leaning towards leaving the projections in tact and calling them the
most pessimistic once. I believe that we can do somewhat better if we
keep the same figure of merrit. In that case I would be inclined to
split off one more low Q^2 point but this is open to discussion.
Things left to do (in case I'm granted a reprieve)
1)Use fool blastmc and see if the results change
2)Right now the error bars are only statistical. Try to estimate the
systimatic ones as well.
3)Do a quick background due to target, misidentified protons correction.
This would effect the third Q^2 point.
4)Include more data from this weekend. I believe that these are the
"golden runs" in terms of figure of merit and it would be a shame not to
use as much of it as possible.
5)Make some statement about higher Q^2 data (beyond cerenkov coverage),
though I have not even looked at it.
The overall polarization number I used was Pe*Pz = 0.463. Can someone
check me on this.
Please, let me know what you think.


This archive was generated by hypermail 2.1.2 : Mon Feb 24 2014 - 14:07:31 EST